Welcome to ProteinPlot’s documentation!
Welcome to the documentation for ProteinPlot, a university project package for analyzing PDB entries in Python.
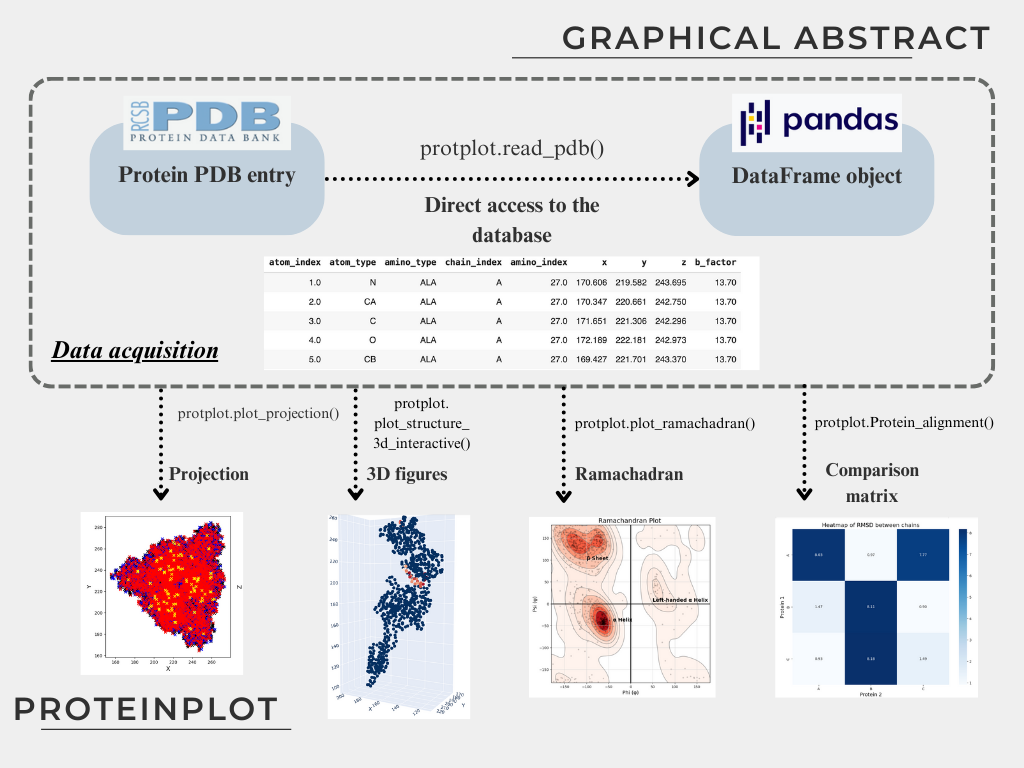
ProteinPlot is a lightweight tool for managing .pdb files, designed to facilitate easy manipulation and visualization of protein structures. The package provides multiple functions for structural analysis and visualization, and leverages pandas DataFrames for simplified and flexible data handling—even for users new to Python.
Introduction
ProteinPlot aids in the analysis of PDB entries. Files from the RCSB Protein Data Bank (rcsb.org) are loaded into pandas DataFrames, enabling intuitive and efficient data manipulation. The package includes examples of protein structure visualization.
Description
PDB entry reading into pandas DataFrames
Download and load PDB files directly from rcsb.org into pandas for easy processing.
Structure alignment and comparison
Basic chain alignment tools for identifying structural similarity between two PDB entries.
Torsion angle calculations between user-defined atoms.
Ramachandran plots
Generate informative Ramachandran plots to visualize secondary structure distributions.
2D and 3D visualizations
Slice plots for 2D representation of protein structures.
Static and interactive 3D plots using Plotly and Matplotlib.
Installation
You can install ProteinPlot via pip:
pip install ProteinPlot
PyPI page: PyPI
Github page: Github
Example usage: Example Google Colab notebook
Requirements
Installing ProteinPlot via pip will automatically install the following dependencies:
numpy
pandas
seaborn
matplotlib
plotly
For convenience, jupyter is also installed to provide a basic local IDE for notebook-based workflows.